In Class Ex 06(Tableau for time series)
Cycle Plot for time series
arrival time series dataset could be downloaded here.
| step | description | screenshot |
|---|---|---|
| 0 | raw data | 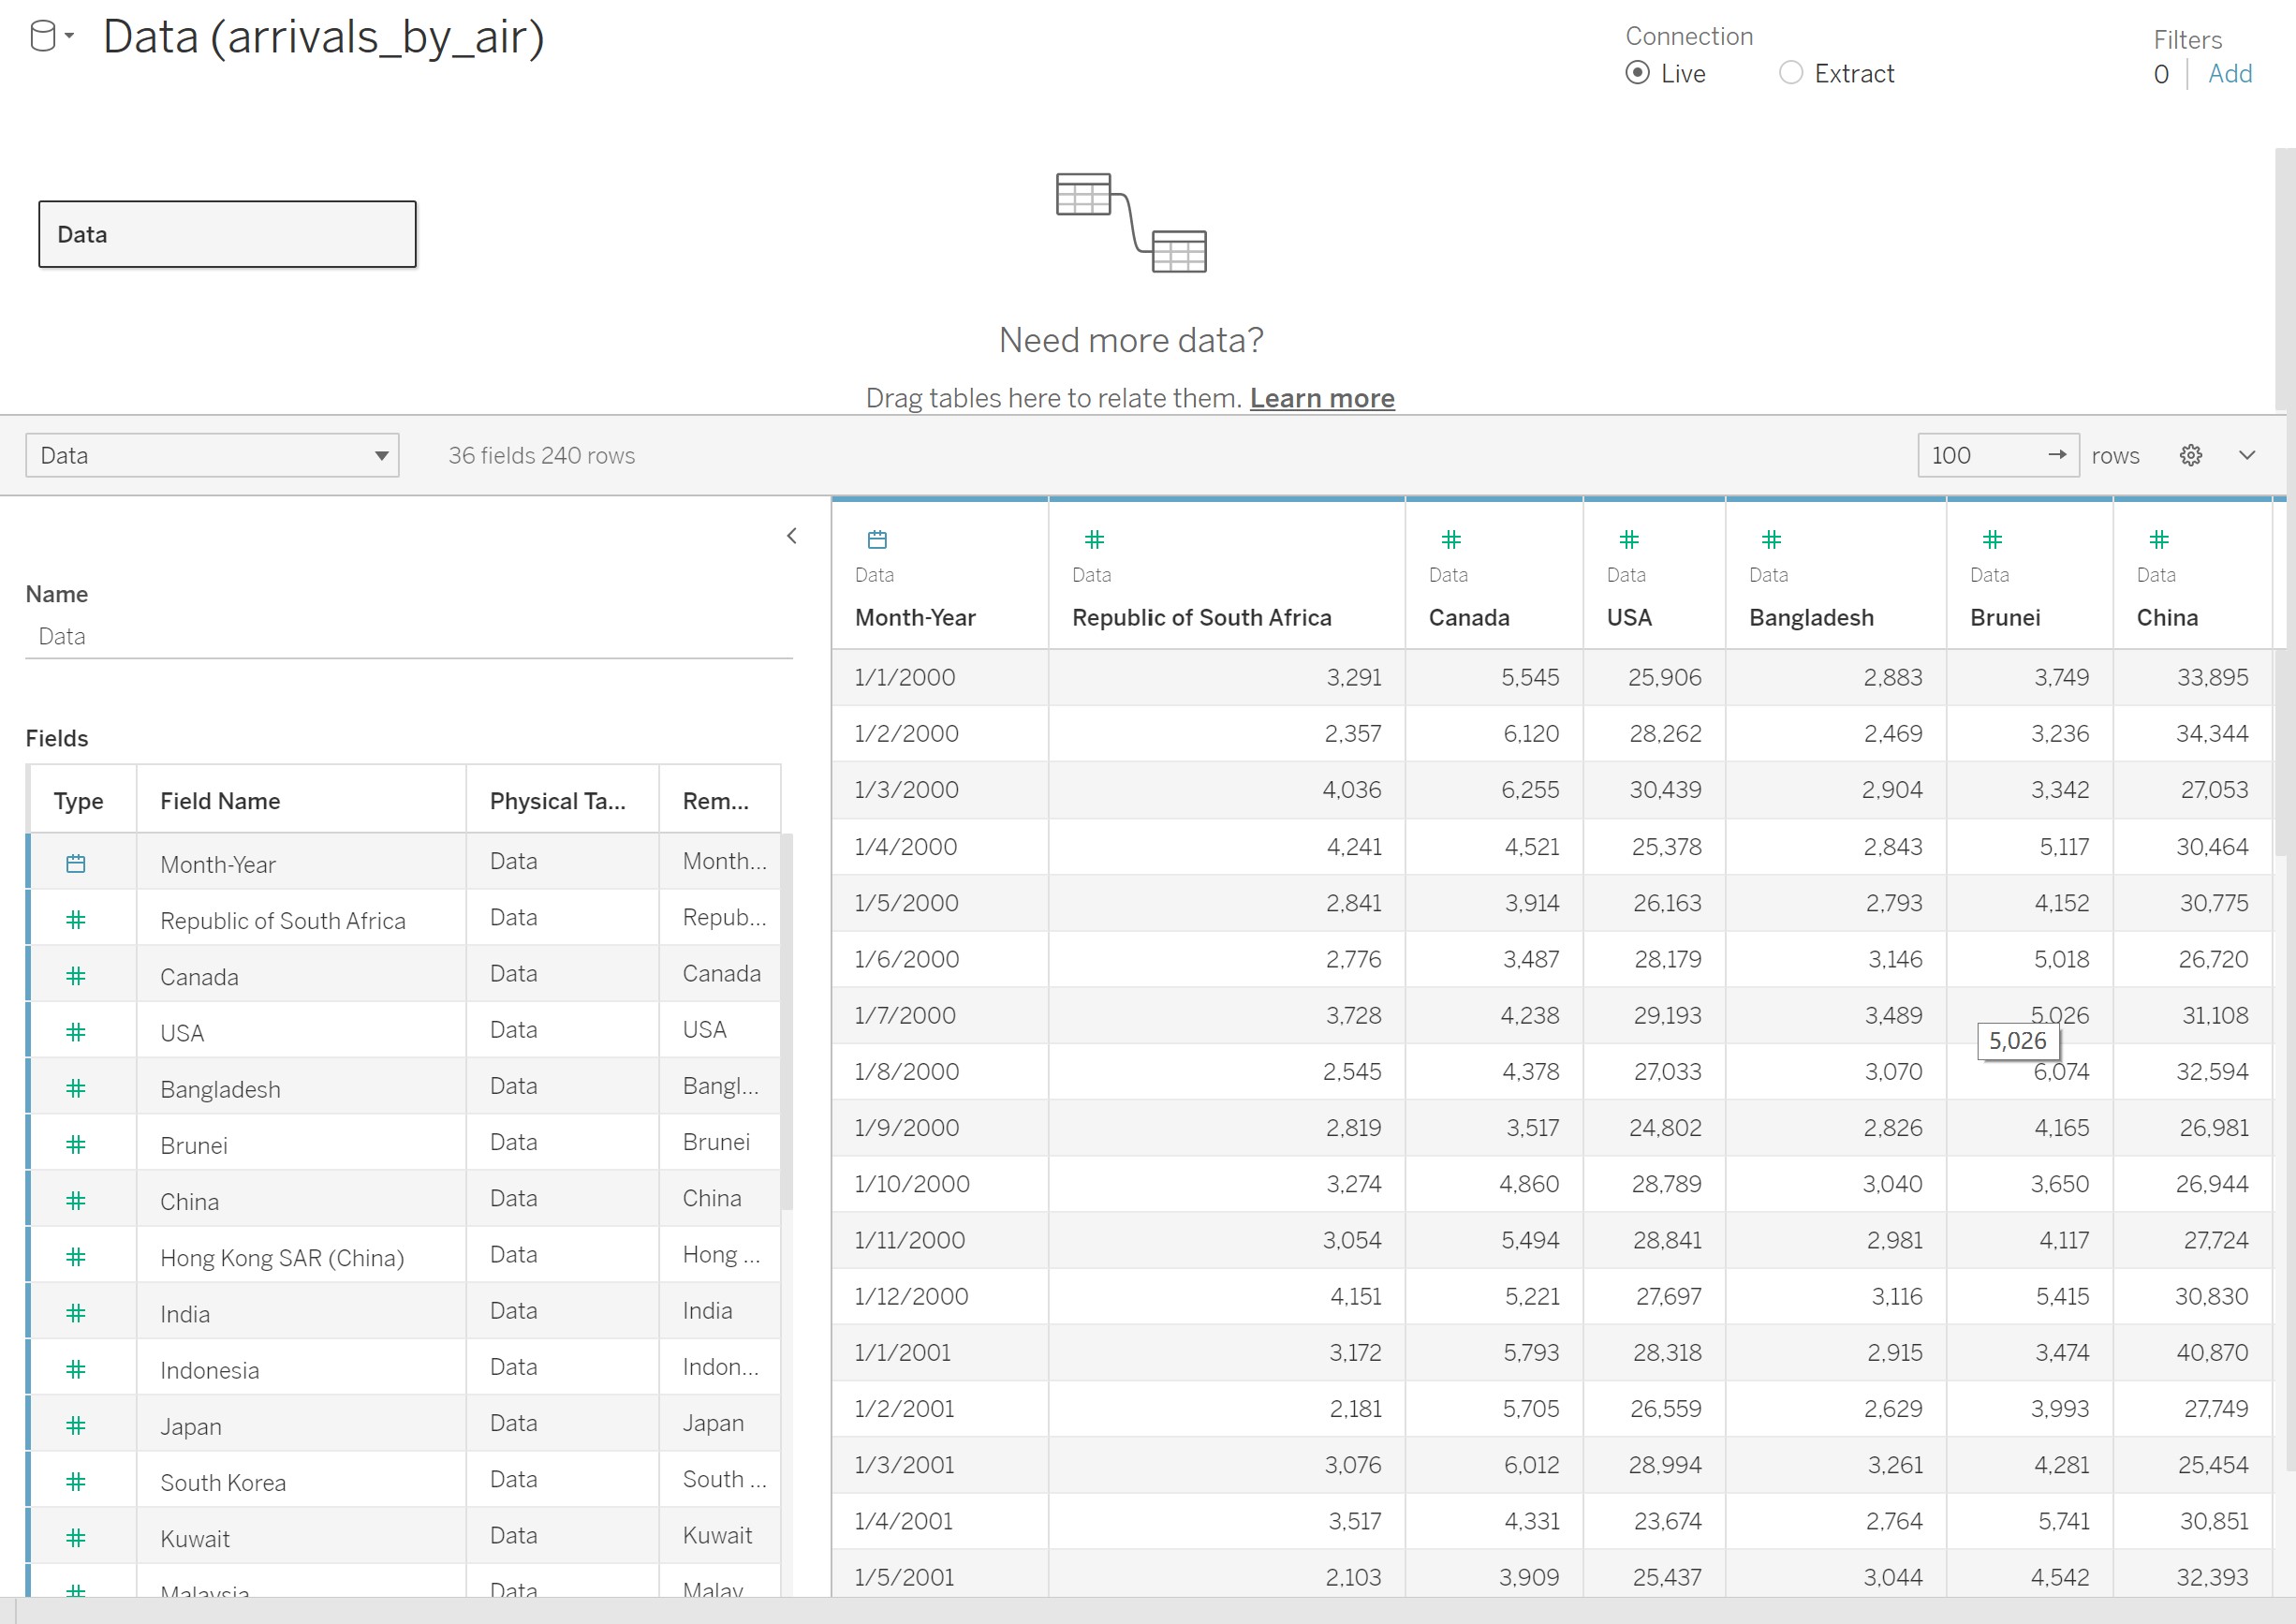 |
| 1 | pivot long | 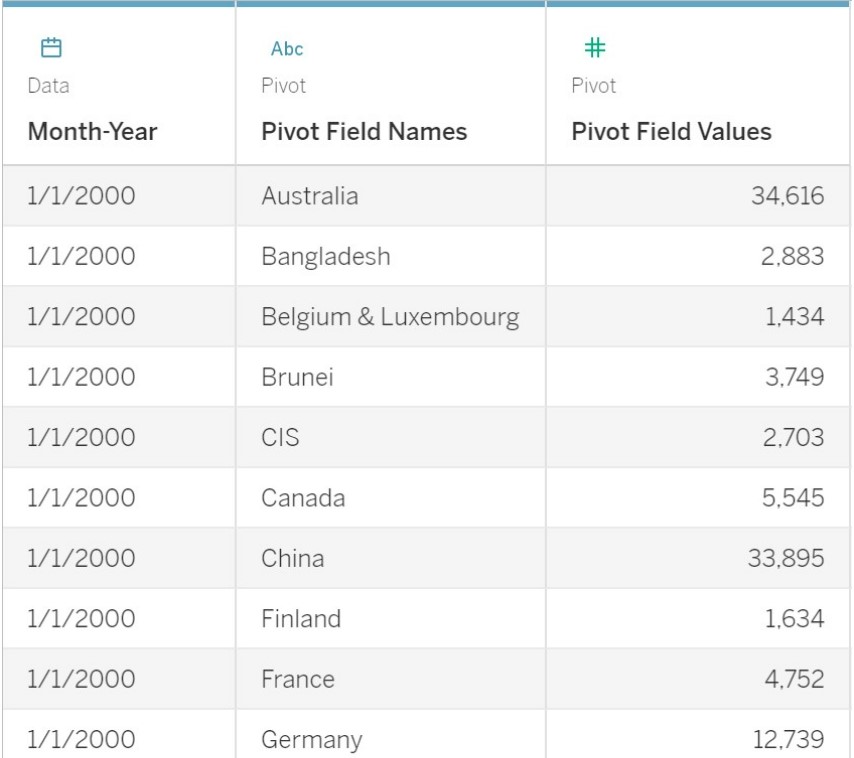 |
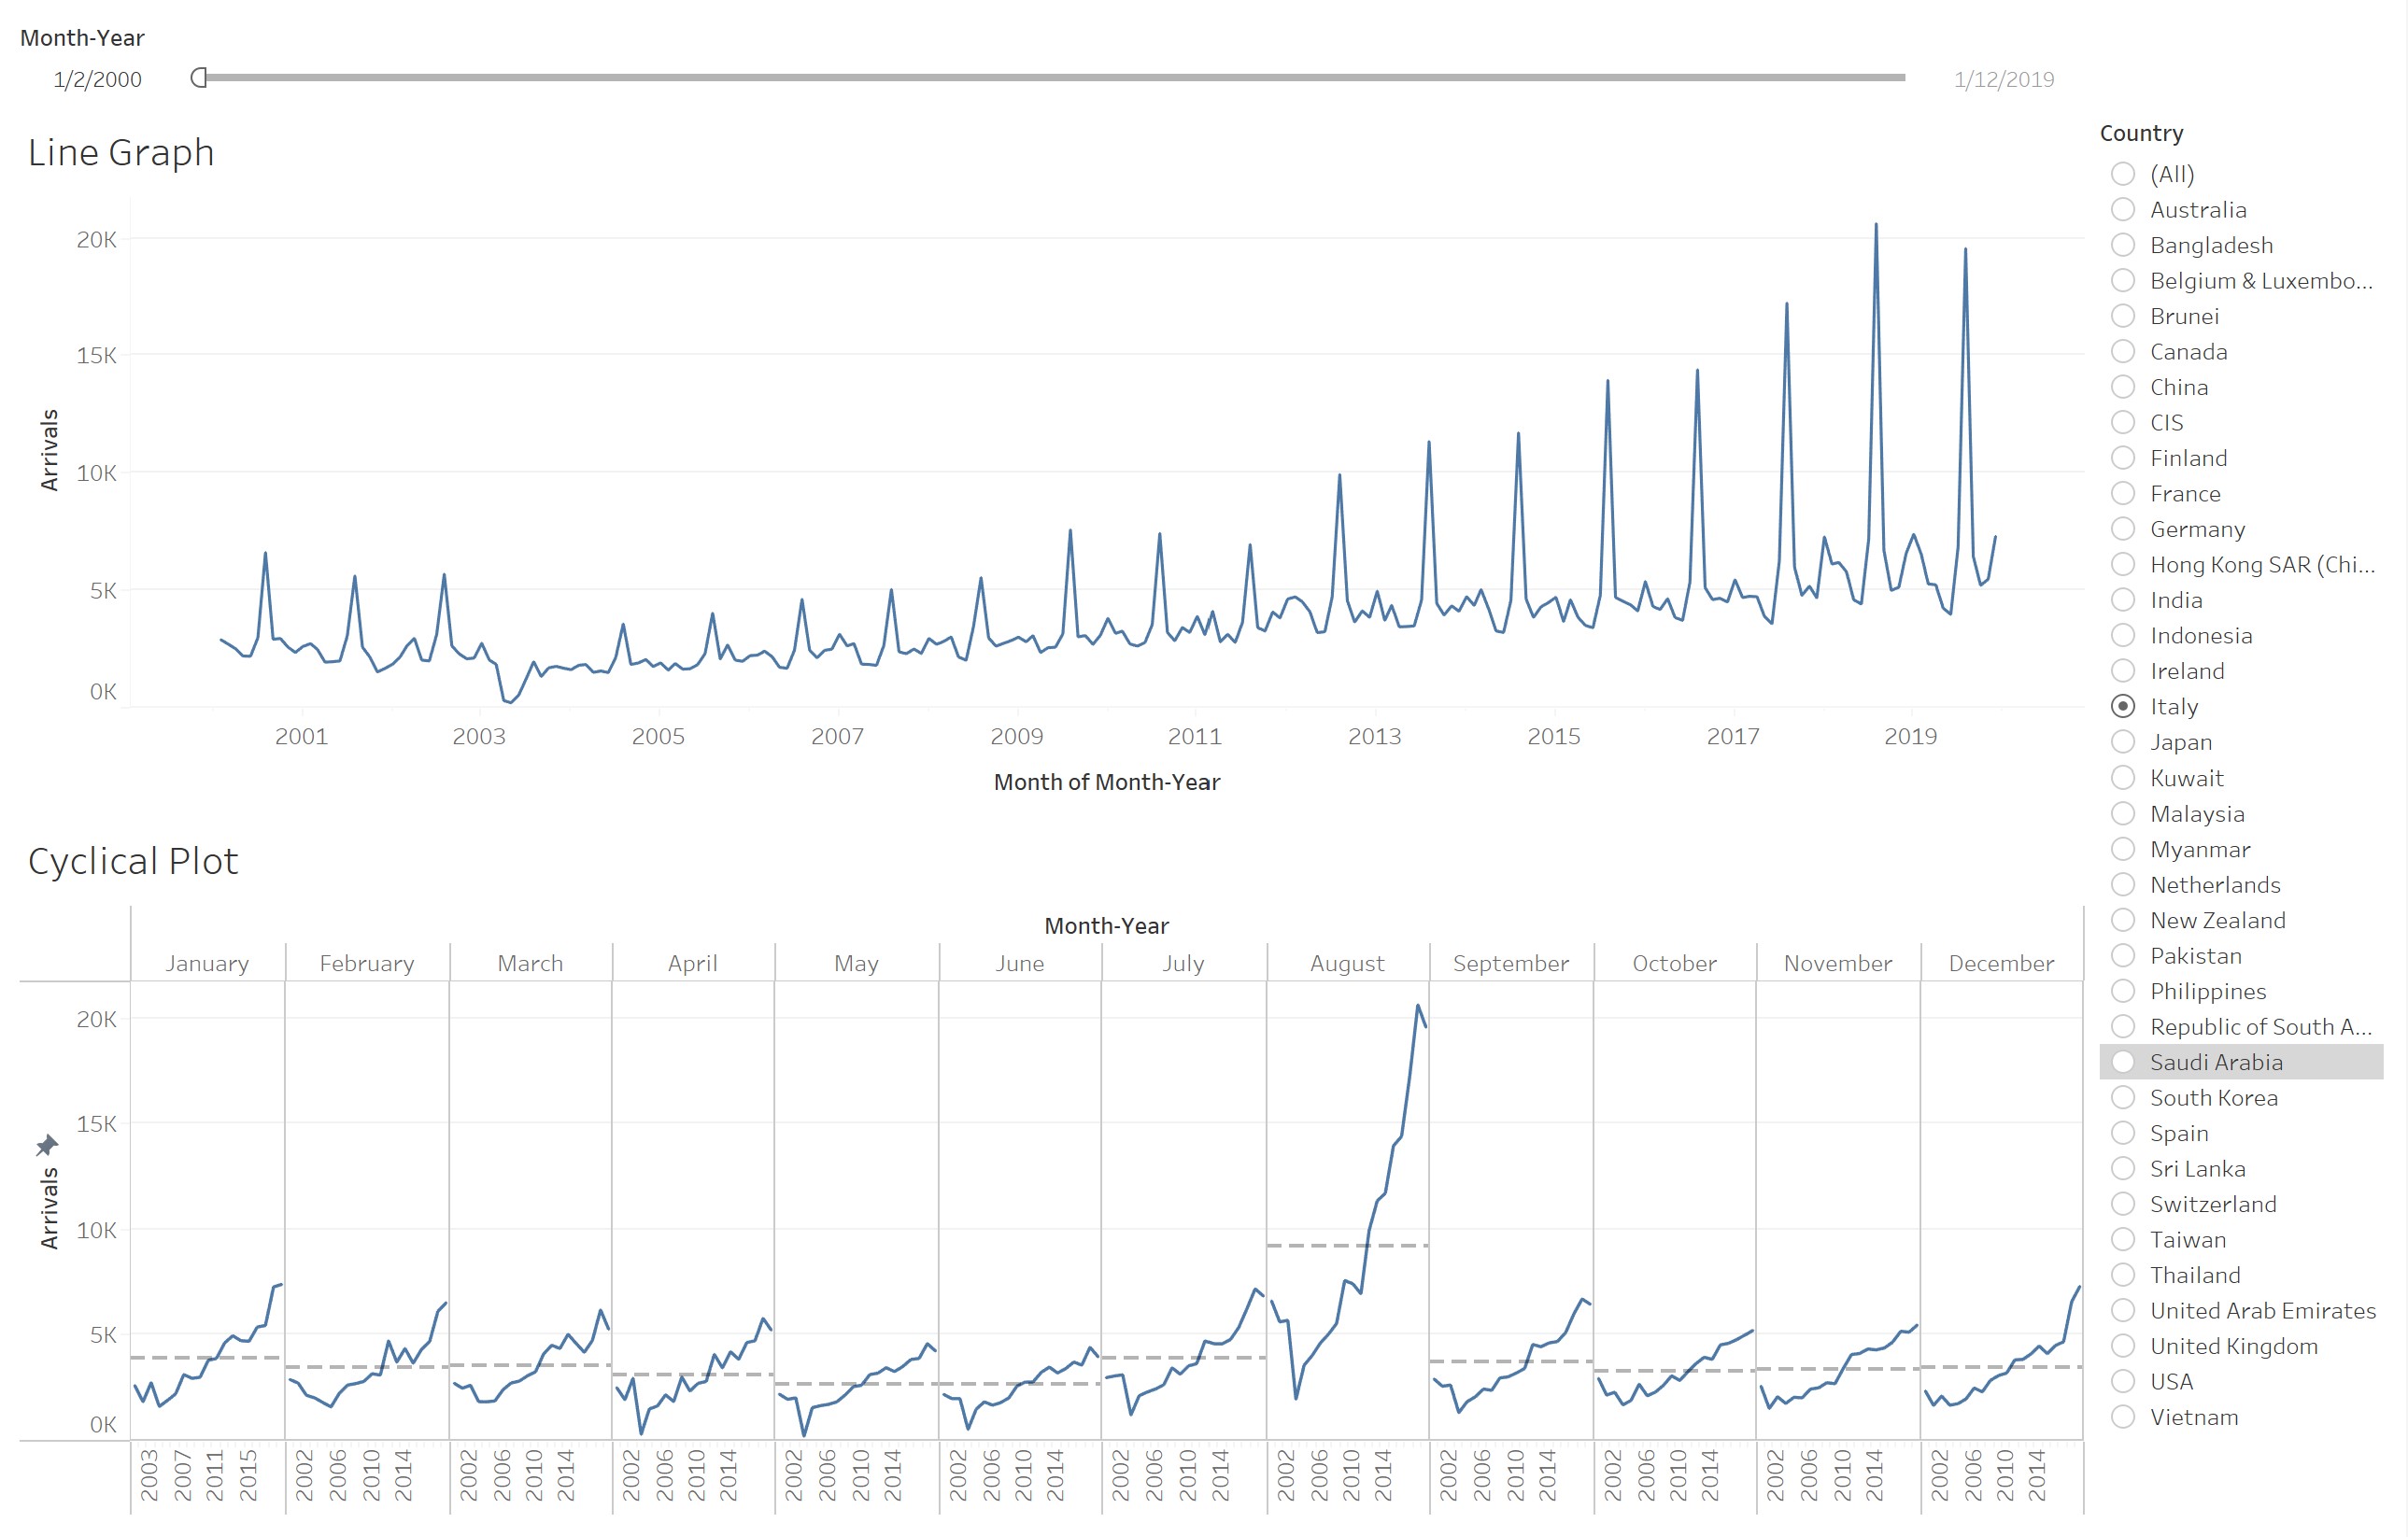
| 2 | add filters to plot the time series for each country for a specific range of time. | 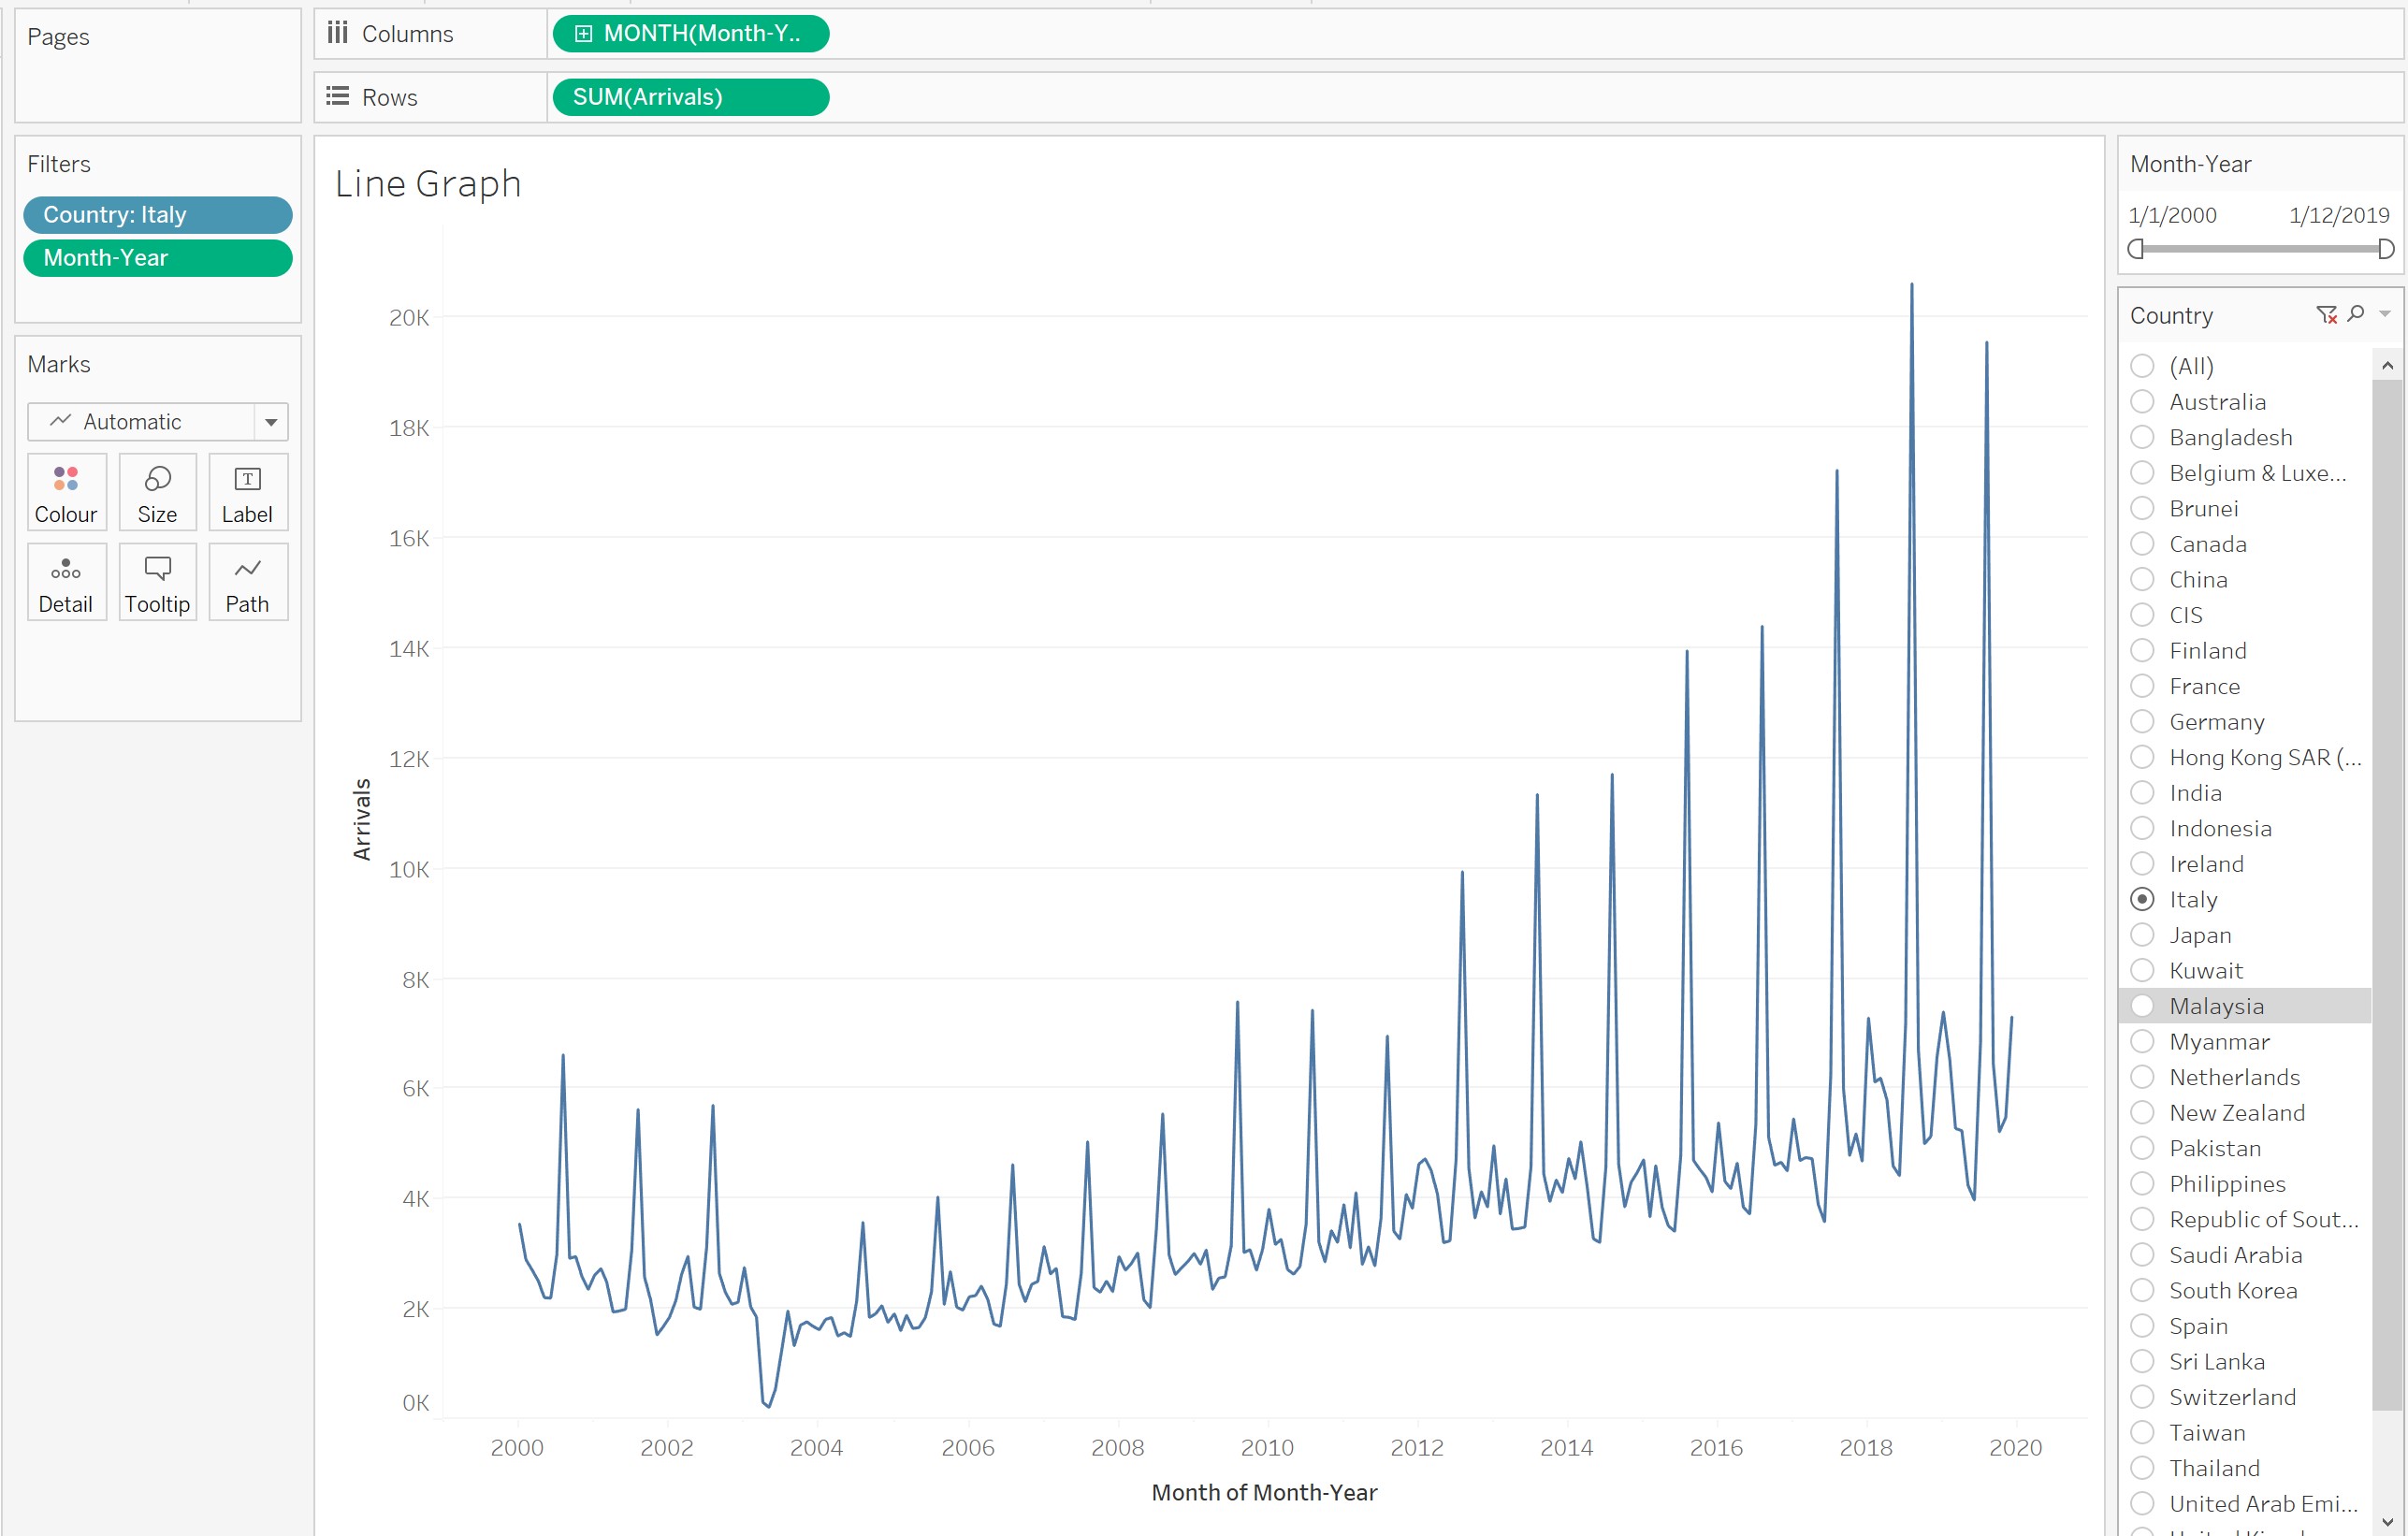 |
| 3 | split the trend and the seasonal using cyclical plot(year of individual month) Findings: Italy August F1, drastic increase over the year in August in Italy |
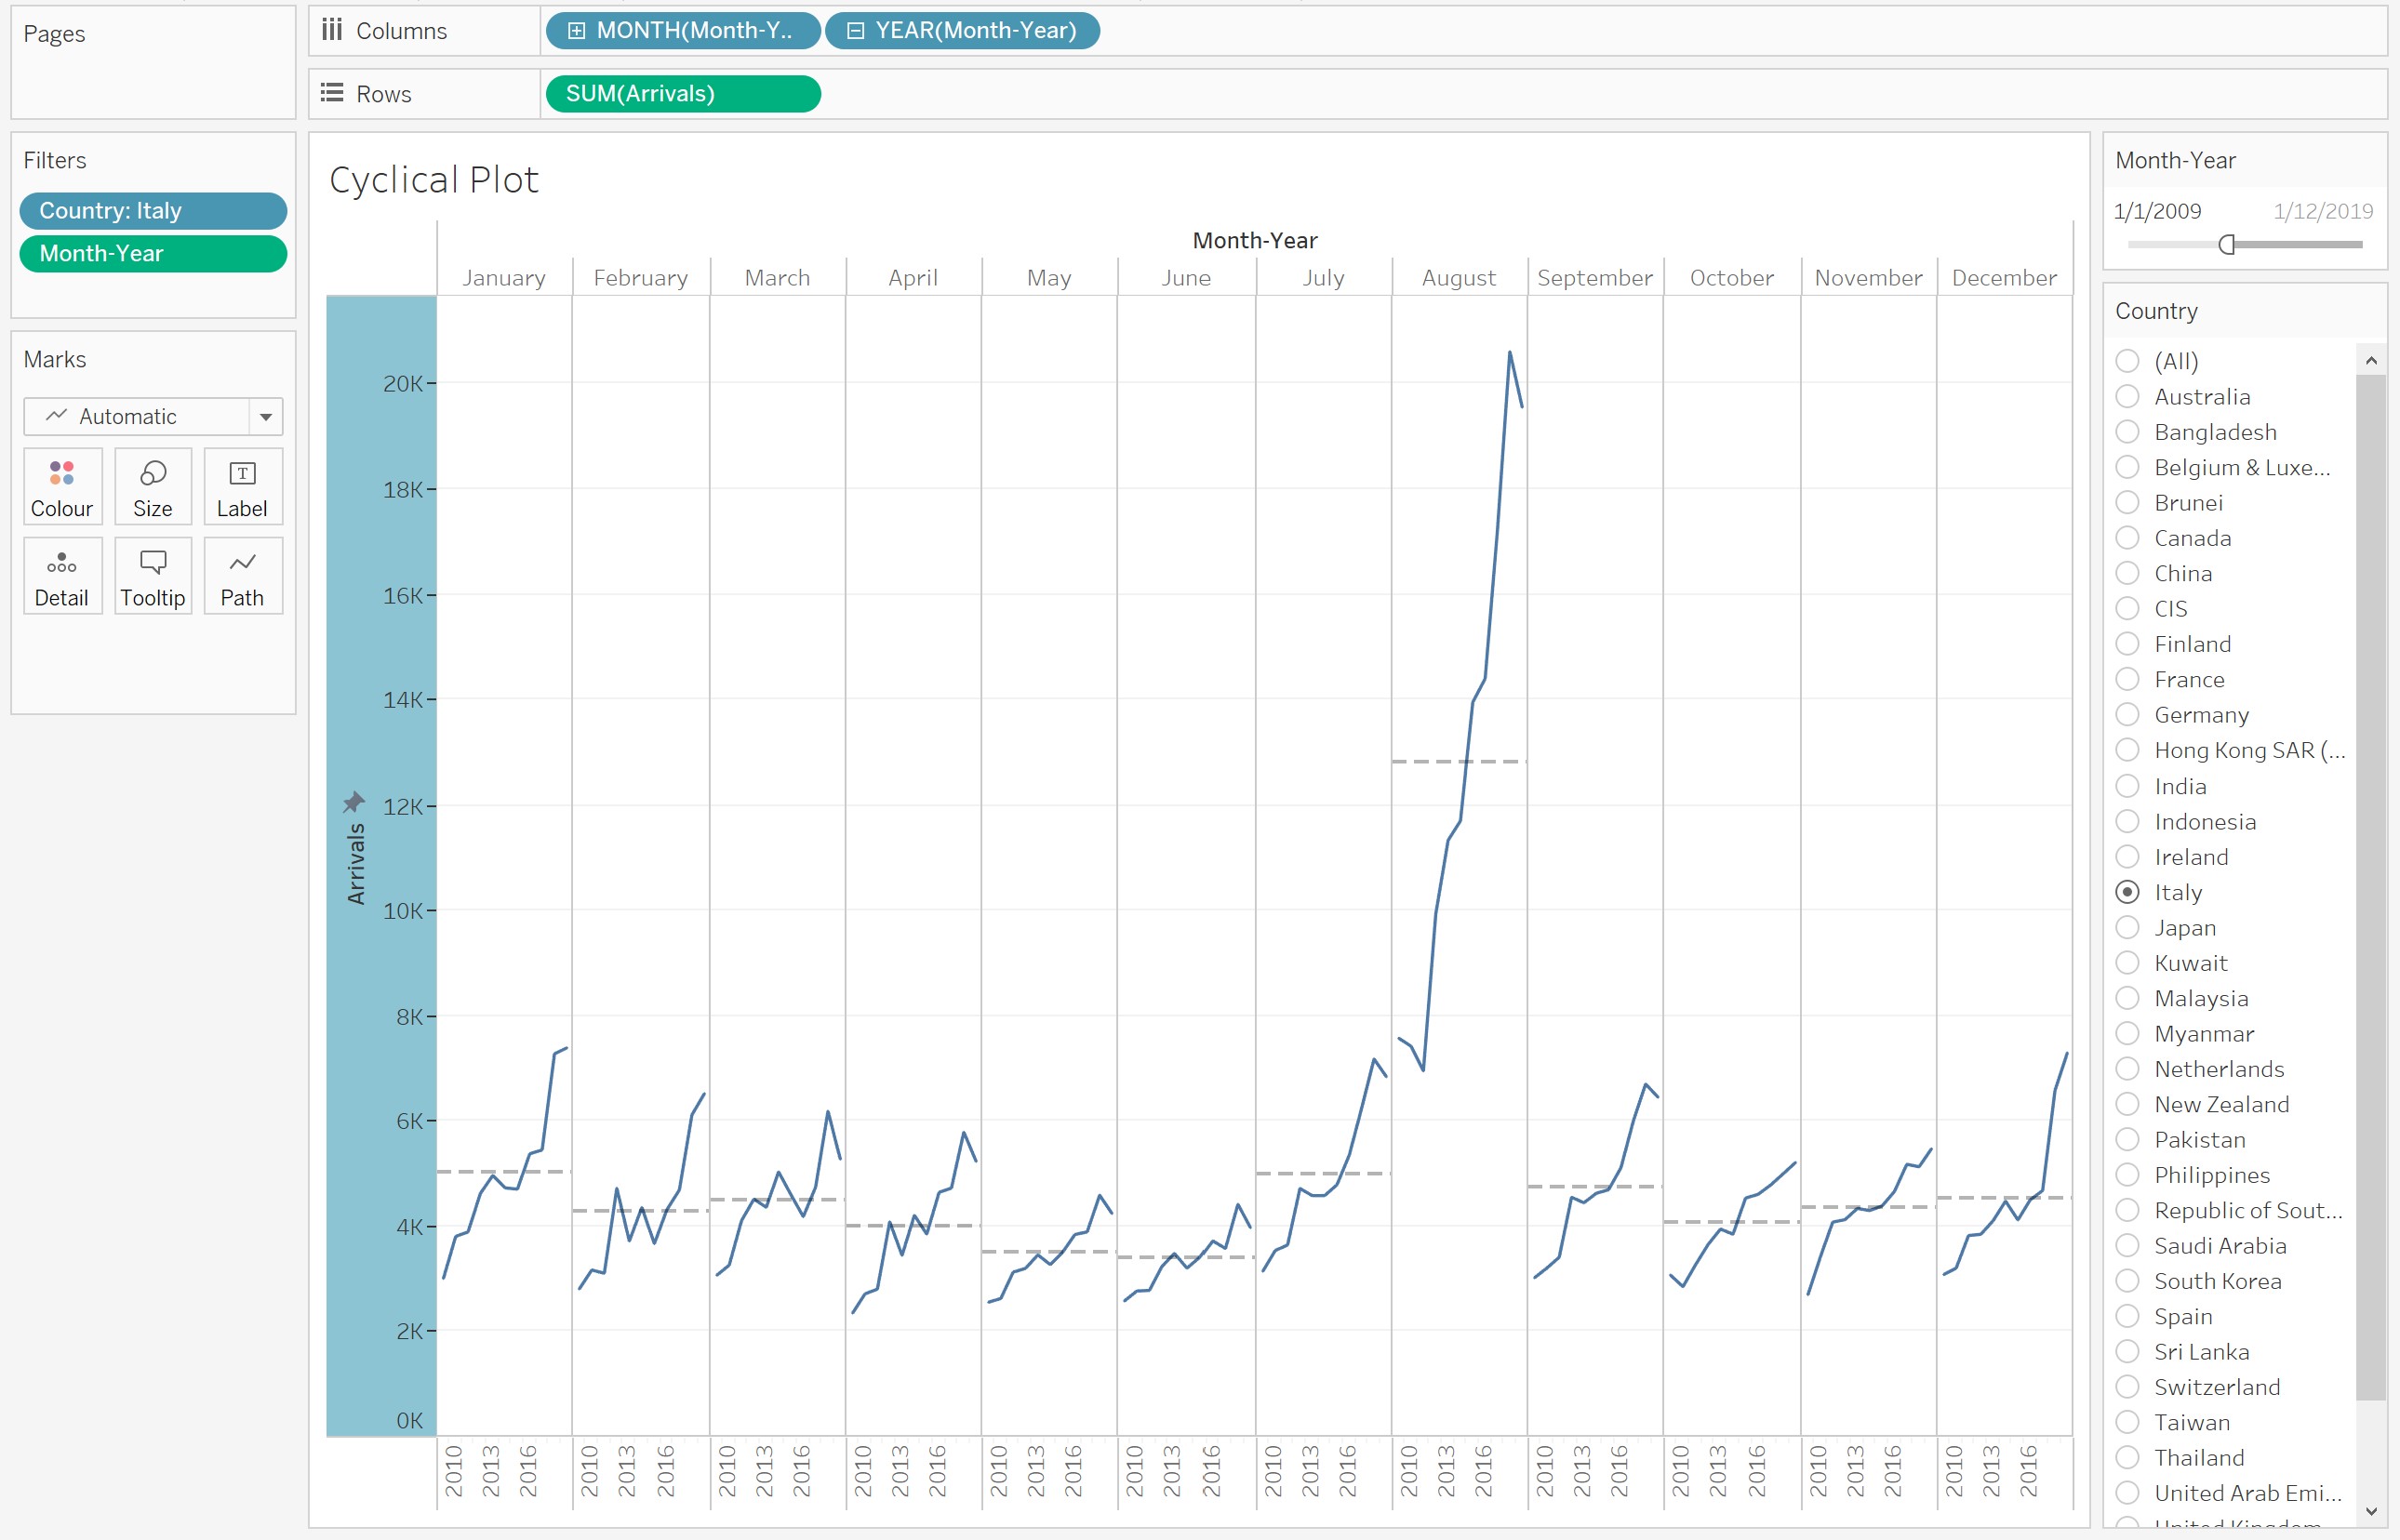 |
| 4 | build a dashboard to gain a better understanding of the arrivals for each country. note: synchronize the filter of country and time range for both worksheets. |
 |
The tableau dashboard can be access here.
Calender Heatmap for time series
The tableau dashboard can be accessed here.
Slopegraphs for time series
The tableau dashboard can be accessed here.
Animation using pages
The tableau dashboard can be accessed here.