#always load the tidyverse lastly
pacman::p_load(ggiraph,tidyverse)In-class Exercise 3
Getting Started
Installing and loading the R Packages
Two packages will be installed and loaded. They are tidyverse and ggiraph.
Import data
exam <- read_csv("data/Exam_data.csv")Create Vivuslisation
plot1 <- ggplot(data = exam,
                aes(x = MATHS)) +
  geom_dotplot(dotsize=0.5) +
  ggtitle("Distribution of Maths Scores")
plot1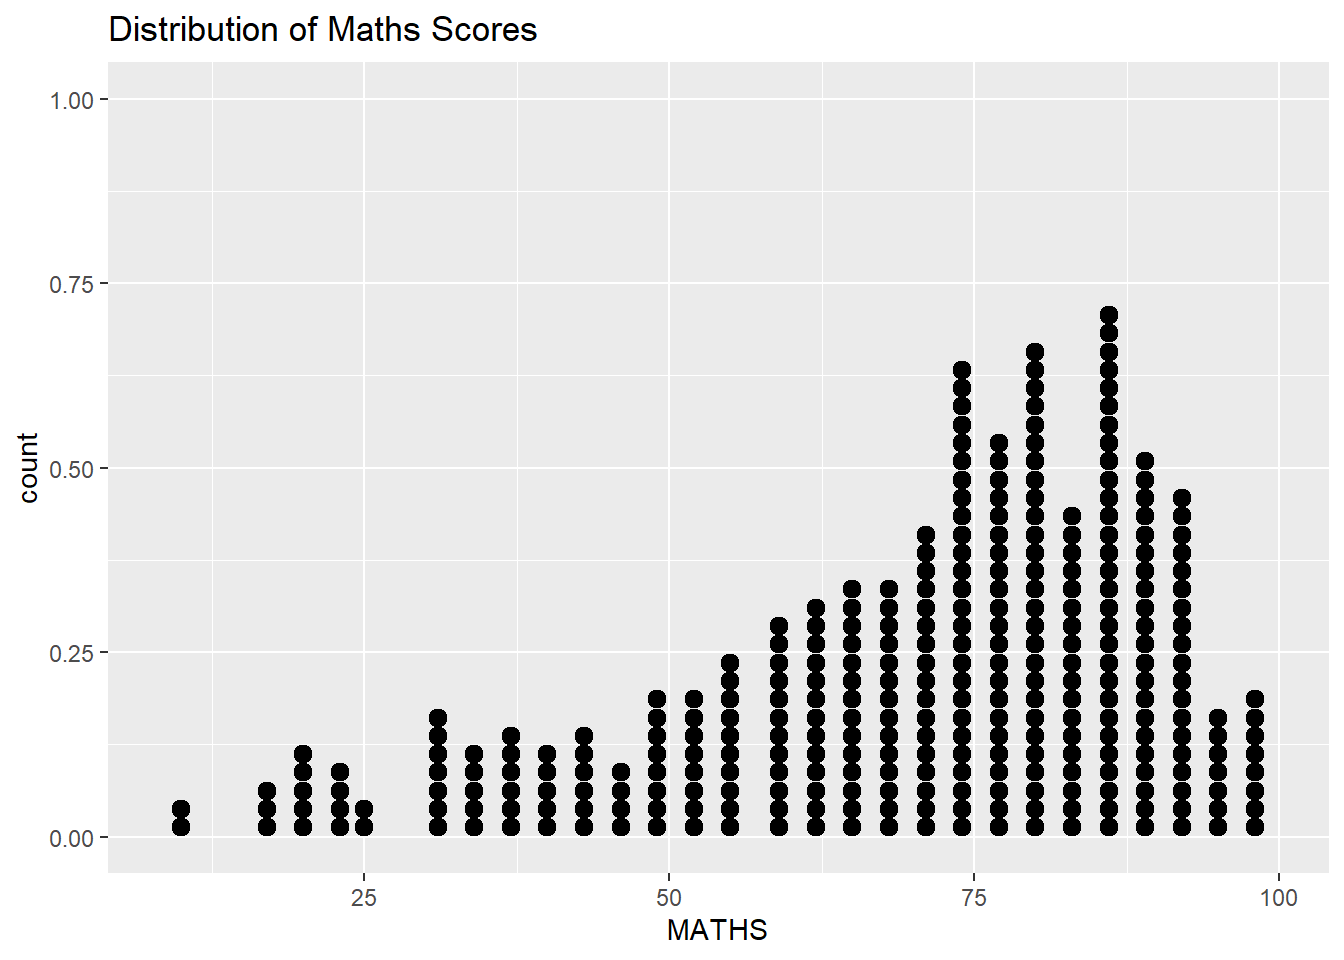
Create interactive dotplot
plot2 <- ggplot(data = exam,
                aes(x=MATHS)) +
  #create interactivity
  geom_dotplot_interactive(
    aes(tooltip = ID),
    stackgroups = TRUE,
    binwidth = 1,
    method = "histodot") +

  scale_y_continuous(NULL,breaks = NULL)

# create widget for interactivity
# need to pass over the ggplot object to girafe
girafe(
  ggobj = plot2,
  #Create space
  width_svg = 6,
  height_svg = 6 *0.618
)
Display more than one in tooltips
exam$tooltip <- c(paste0(
  "Name = ", exam$ID,
  "\n Class = ", exam$CLASS
))

plot3 <- ggplot(data = exam,
                aes(x=MATHS)) +
  #create interactivity
  geom_dotplot_interactive(
    aes(tooltip = exam$tooltip),
    stackgroups = TRUE,
    binwidth = 1,
    method = "histodot") +

  scale_y_continuous(NULL,breaks = NULL)

# create widget for interactivity
# need to pass over the ggplot object to girafe
girafe(
  ggobj = plot3,
  #Create space
  width_svg = 6,
  height_svg = 6 *0.618,

    )
Cusomise tooltip
tooltip_css <- "background-color:white;
font-style:bold;color:black;"


exam$tooltip <- c(paste0(
  "Name = ", exam$ID,
  "\n Class = ", exam$CLASS
))

plot3 <- ggplot(data = exam,
                aes(x=MATHS)) +
  #create interactivity
  geom_dotplot_interactive(
    aes(tooltip = exam$tooltip),
    stackgroups = TRUE,
    binwidth = 1,
    method = "histodot") +

  scale_y_continuous(NULL,breaks = NULL)

# create widget for interactivity
# need to pass over the ggplot object to girafe
girafe(
  ggobj = plot3,
  #Create space
  width_svg = 6,
  height_svg = 6 *0.618,
  options = list(
    opts_tooltip(
      css = tooltip_css
    )
  )
)
display statistics <- check {function}
tooltip <- function(y,ymax,accuracy = 0.01) {
  mean <- scale :: number(y,accuracy = accuracy)
  sem <- sacle


}
Data_id
plot5 <- ggplot(data = exam,
            aes (x = MATHS)) +
  geom_dotplot_interactive(
    aes(data_id = CLASS),
    stackgroups = TRUE,
    binwidth = 1,
    method = "histodot"

  ) +

  scale_y_continuous(NULL, breaks = NULL)


girafe(
  ggobj = plot5,
  #Create space
  width_svg = 6,
  height_svg = 6 *0.618)
change hover effect
combine hover+tooltip